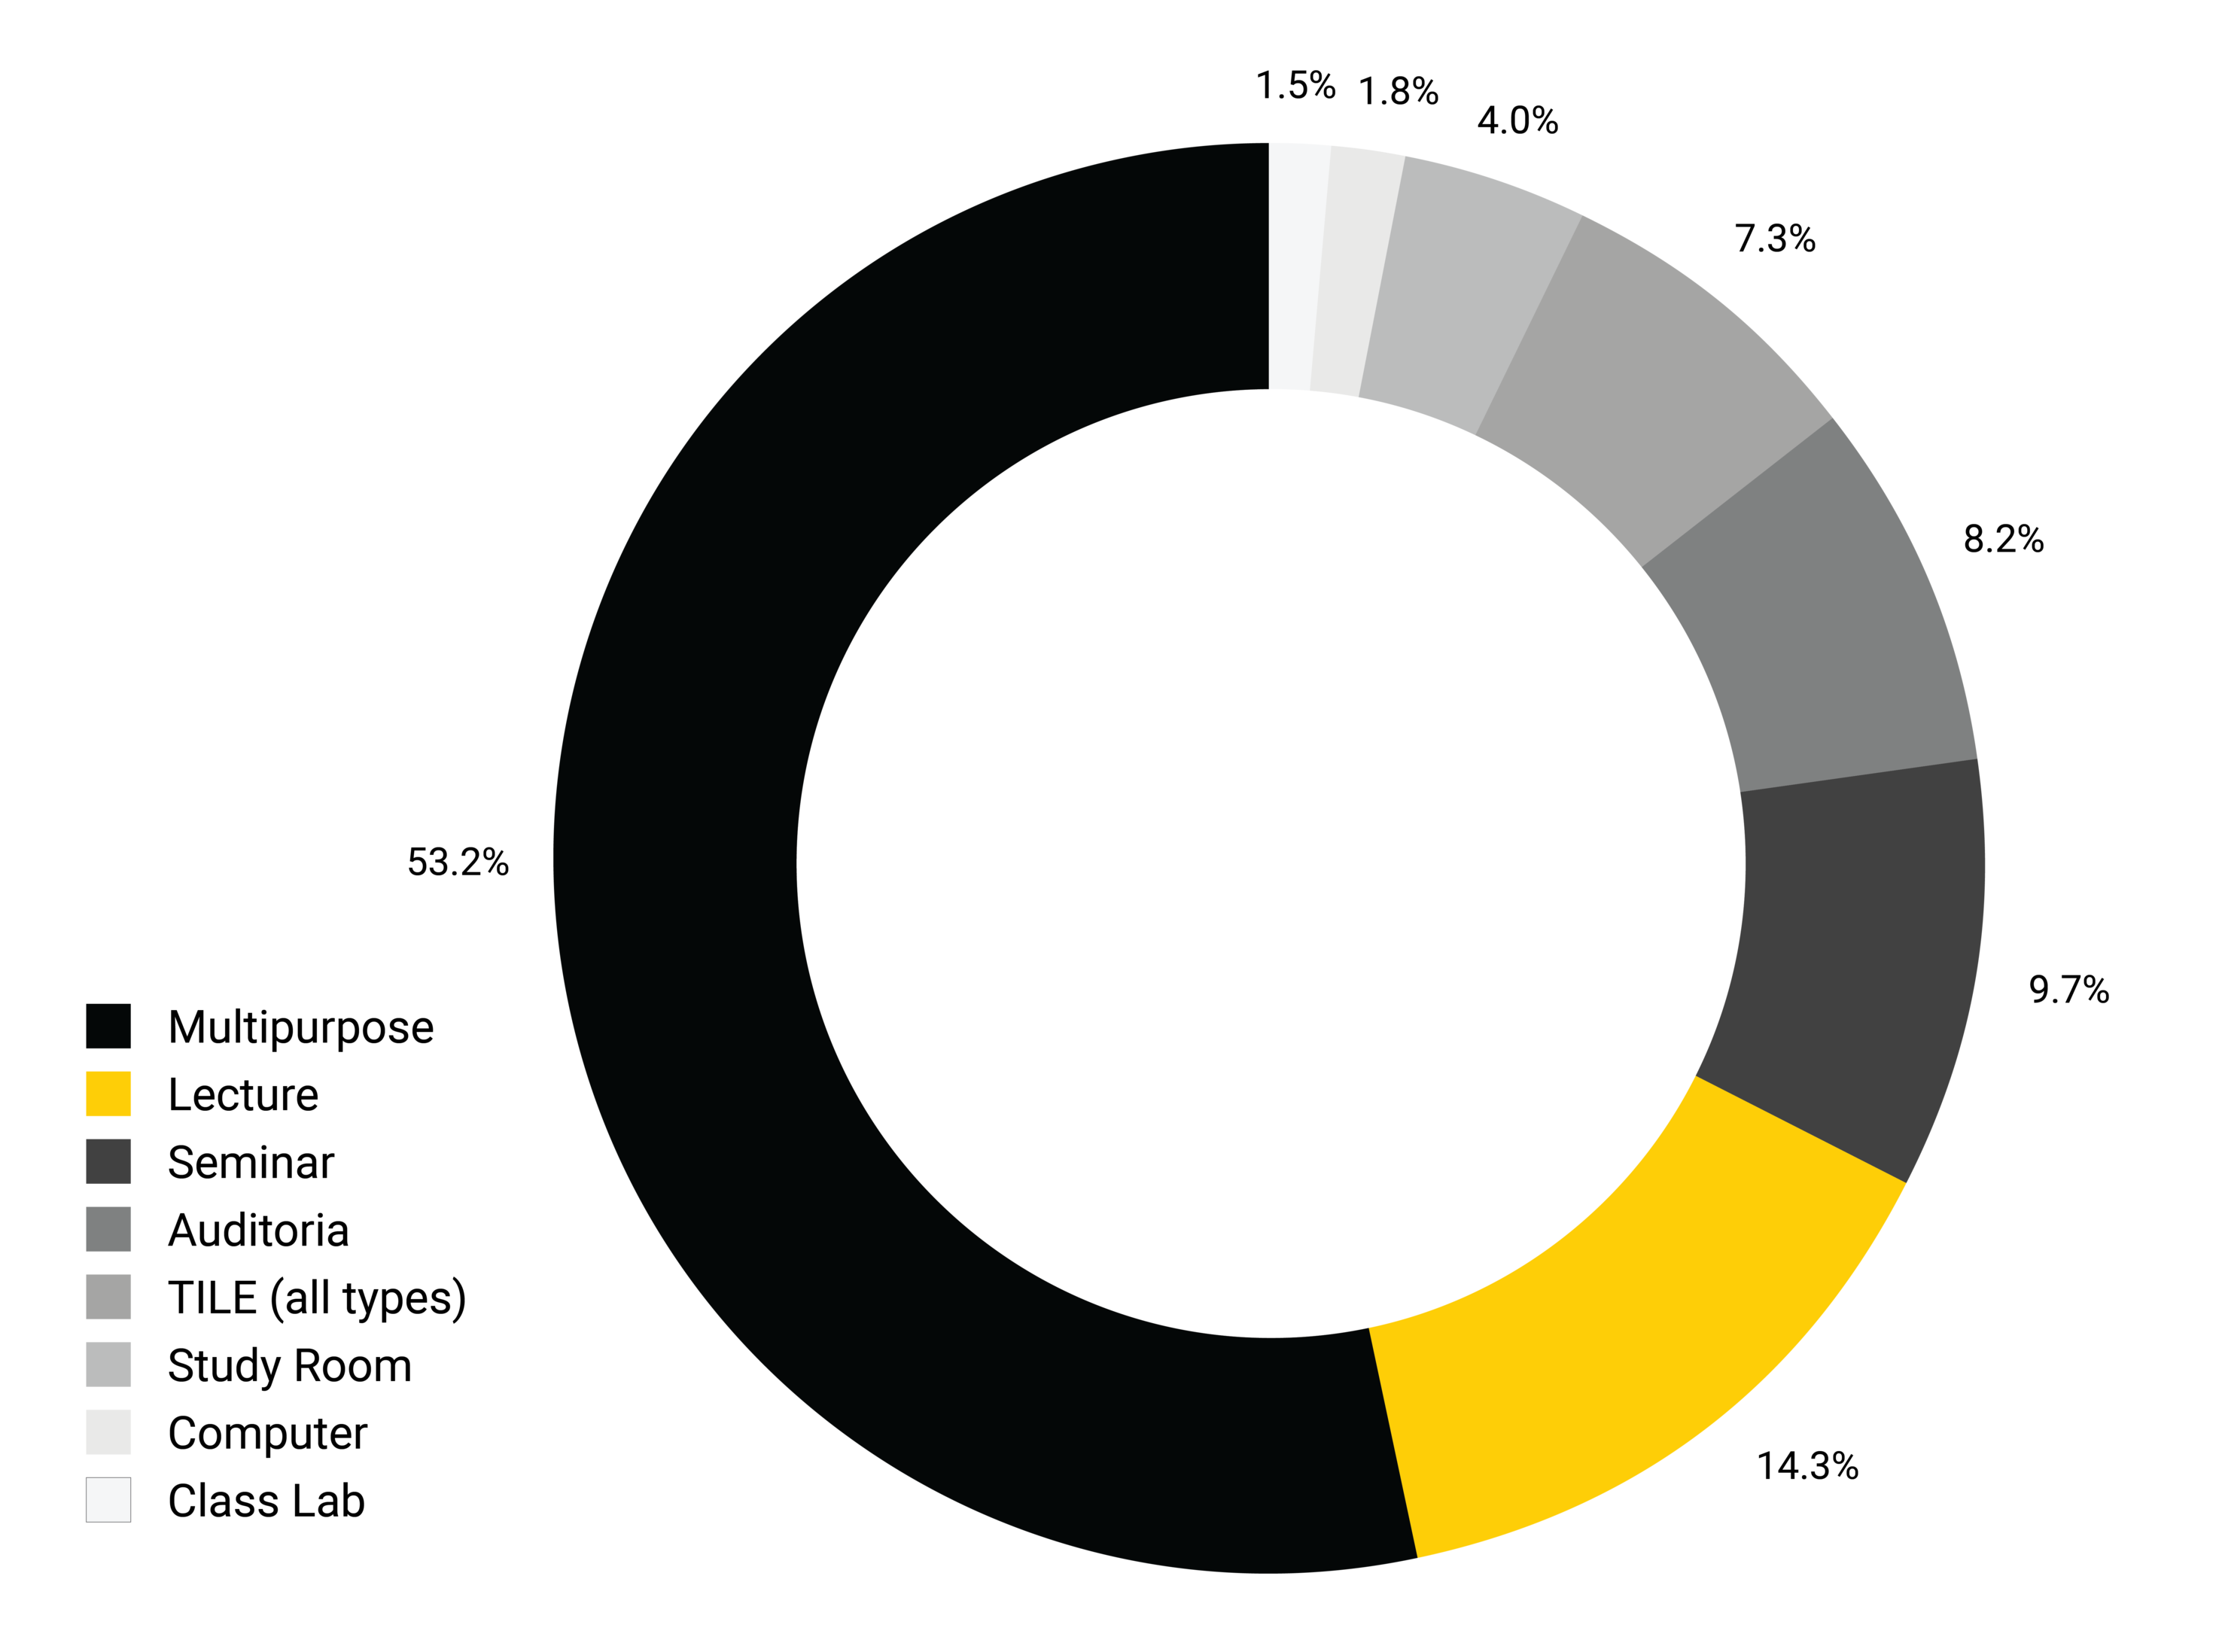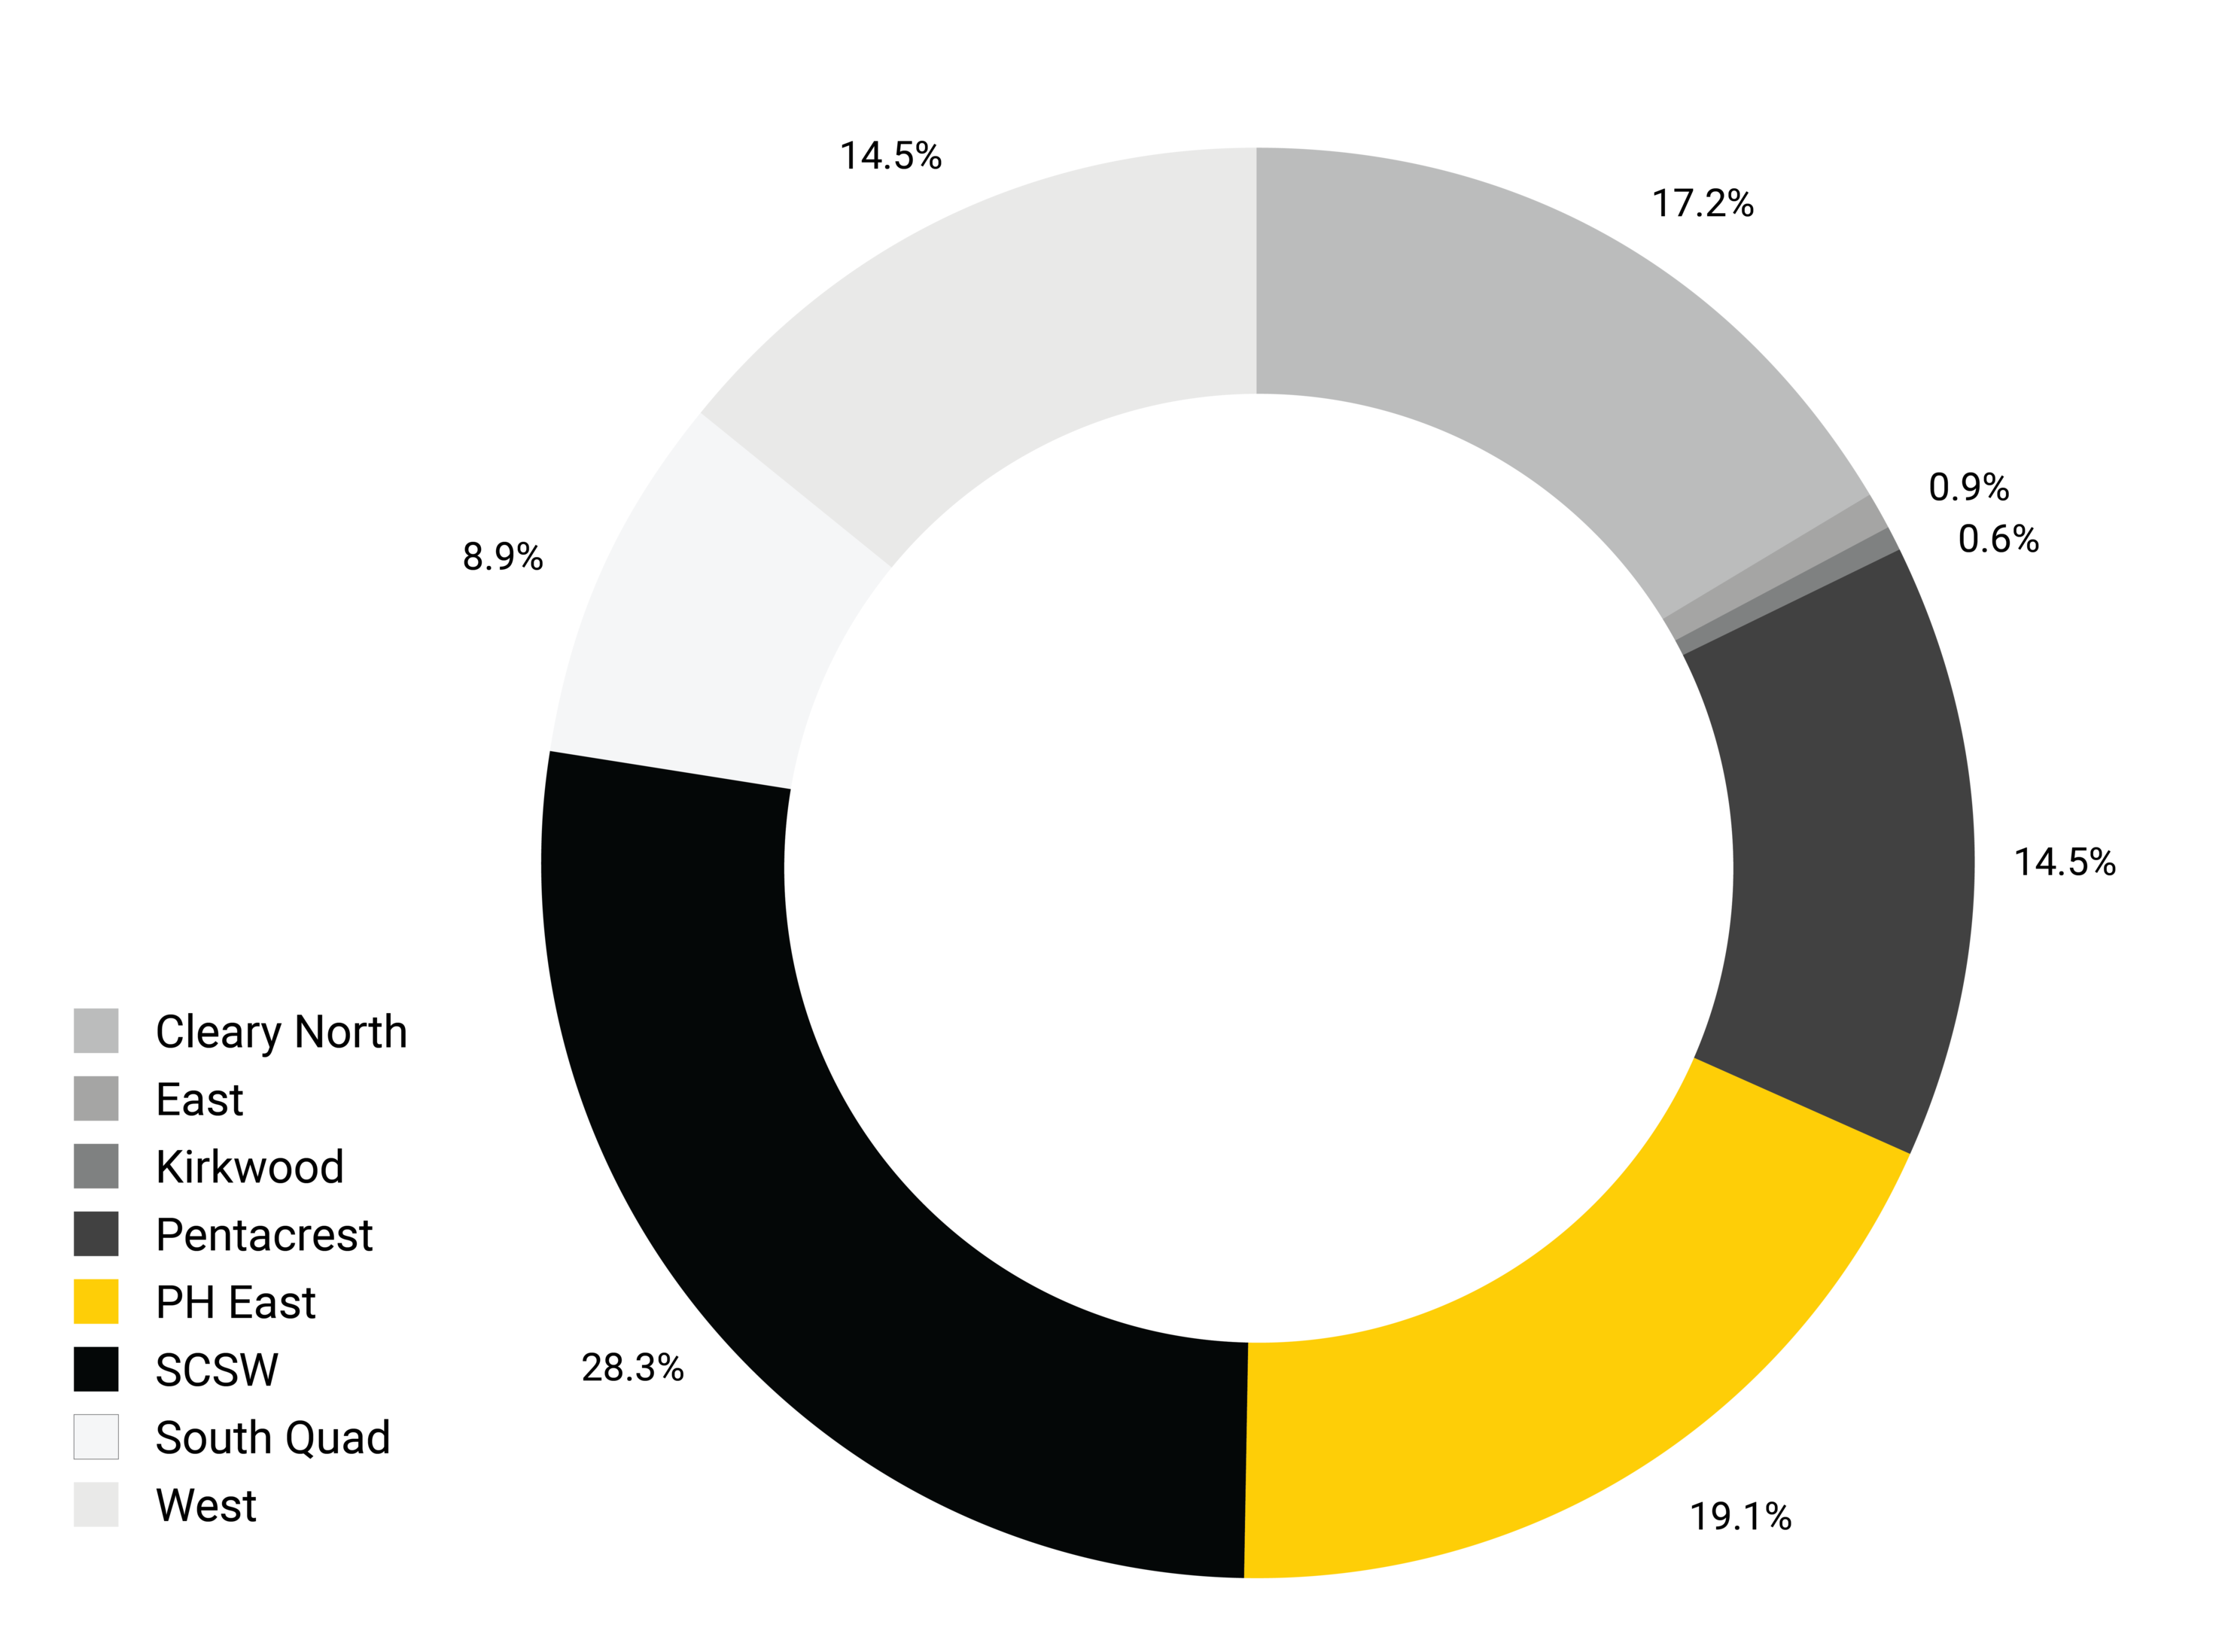
322 +
University Classrooms

13
Study Rooms

24
Active Learning Classrooms
Allocations
Ad Astra Allocation Summary
Ad Astra Allocation Summary Report
Summary of allocation data from Ad Astra based on pre-session load. Use the tabs across the top of the page to switch your view.
Course Offerings
Classroom Availability
Using Astra data, this report shows availability of University Classrooms based on common standard meeting patterns and room capacity grouping.
Historical vs Optimal Enrollment
This report shows current and opt enrollment counts at the course level for one or multiple sessions using census and daily snapshots.
Room Schedule
Using data from Ad Astra, shows the activities scheduled into the chosen room for the given time frame.
Schedule Conflict Finder
This report identifies potential scheduling conflicts or "collisions" across different statuses between colleges and courses.
Data Snapshot: 24 hours ago; from the data warehouse
What are some practical applications of the data:
- To evaluate if proposed time/day adjustments will cause registration disruptions for current session when working a revise offering form
- To evaluate if a proposed time/day will cause student registration overlaps during new semester planning
To use this report:
- Select a session for which you'd like to schedule a course section
- Select a course level
- Select the course college, subject, and planner status to limit the conflicts returned
- Enter the days of the week and start/end times for which you're considering scheduling a course section
Section/Course Offerings Heatmap
A graph showing all the scheduled sections for the chosen session and college/academic unit/course subject at each respective 15-minute interval, for each day of the week. Sections included are limited to those considered on-campus and with a scheduled start and end time. Click on an interval to generate a detailed list of those sections, which will appear below the graph.
In addition to the columns shown for the individual sections, session information, college, academic unit, the off-cycle flag, and the is-location-arrangeable flag are included in the downloaded version using the links at the bottom of that table.
Capacity Reports
Course Enrollment Capacity Trend
Course Enrollment Capacity Trend Report
This report consists of the following data parameters: section count, average optimum enroll count, average enroll count, average vacant count and average fill rate, and average enrollment by academic year for the courses selected.
The report provides two views of historical enrollment trending filtered by college and academic departments through trend lines or table options on individual course section types. Please note, that this report is very similar to Instructional Capacity – Course Fill Rate Trend. This report provides an option to view the data for each section type exclusively.
Data Snapshot: 24 hours ago; from the data warehouse
What are some practical applications of the data:
- To project if the number of sections offered is needed over time
- To evaluate the consistency of the fill rate of the sections offered to meet demand
- See column Optimum Enrollment minus Enrollment
To project if the optimum enrollment and actual enrollments are in a satisfactory range to determine section sizes to offer for a new academic term.
Course Enrollment Cross-Tab Comparison
Course Enrollment Cross-Tab Comparison
The report displays enrollment counts by department and course with cross-tab comparison of Early Registration, Day 1, Census, and End of Session snapshots.
Instructional Capacity - Matching Section Offerings to Demand
Section Offerings to Demand Report
This report consists of a list of courses for a selected session, the number of sections, the current and optimum enrollment, fill rate, open seats, restrictions, etc. By default, the results are sorted with the most open seats listed first. However, the report is sortable by largest waitlist, most sections with constrained/excess capacity, most collapsible sections, or current enrollment.
The report calculates the enrollment ratio for a selected term and snapshot by examining the total enrollments and maximum enrollments for all sections of a given course. The report then analyzes the enrollment ratio to determine whether the course has excess capacity, is on target, or is constrained. The report allows for courses to be drilled down into specific details with a hyperlink. Upon drilling down, recommendations of actions will be offered.
The enrollment fill ratio is categorized by three parameters:
- Excess Capacity – section fill rate is (<) less than 92% identified with a red diamond
- On Target – section fill rate range is 93 – 97% associated by green circle
- Constrained – section fill rate is (>) greater than 98% noted with a yellow triangle
Data Snapshot: 24 hours ago; from the data warehouse
What are some practical applications of the data:
- To project if the course is operating in the desired fill parameters. Comparisons to other “like sessions” (defined as fall to fall; spring to spring) and provide insights if the course historically with excess seats or constrained
- To evaluate the consistency in meeting course demand
- To RECOMMEND where scheduling improvements can be made by collapsing sections to improve excess seats. Important: review the course waitlist and section-fill information carefully before taking any action
- Offering the correct number of sections with the proper maximum enrollment projections proactively reduces waste and minimizes registration disruptions
Instructional Capacity - Year Over Year Demand Change by Subject
Year Over Year Demand Change Report
What kind of data is included in this report?
This report consists of the following data parameters: number of sections, demand year 1, demand year 2, demand (difference between years), % change, fill rate, and category consideration.
The report shows the demand changes year over year for subjects within a college. The data provided here is for high-level offerings planning. The Instructional Capacity – Matching Section Offerings to Demand report will provide a tactical course planning tool. Two view options are provided and can be toggled back and forth between a table view and a chart. Additionally, by clicking on a bubble in the chart view or on the hyperlink in the chart view, a breakdown of course data is provided based on demand findings as suggestions only for consideration in course planning.
The category considerations are broken into four groups:
- Consider Expanding - subject areas in the top 50% of growth in demand with course section fill rates of greater than 80%.
- Consider Restructuring - subject areas with limited growth or reduction in overall demand that have fill rates less than 80%.
- Room to Grow - subject areas in the top 50% of growth in demand, but whose fill rates are less than 80%.
- In Equilibrium – subject areas within limited growth or reduction in overall demand that have fill rates above 80%. Also, could be considered as “in balance.”
Data Snapshot: 24 hours ago; from the data warehouse
What are some practical applications of the data:
- To analyze the enrollment demand between two academic years indicating the percentage of change over time
- To assist in course planning where carry-over or replication of previous schedules occur perpetuating ineffective mix of classes for student demand
- To consider recommendations of an action plan for course schedule planning for a new academic term where expanding the number of sections or restructuring the course could offer improvement. Important: review the course waitlist and section-fill information carefully before taking any action
Student Stations Occupied
To analyze the data, select a view from the drop-down menu to toggle between enrollment (student stations) and room occupancy. The cells in the report are color-coded from red to green, where the darkest red indicates the heaviest usage and the darkest green represents the lightest usage.
Exam Reports
Evening Midterm Exam Needs Summary Report
Midterm Exam Needs Summary Report
Provides a list of evening midterm exam needs per academic unit or course subject.
Exams by Session and Type with Conflicts
Exams by Session and Type with Conflicts
Provides a list of exams between the selected times of day for session and exam type chosen. Enables users to view direct conflicts for students with other exams or courses based on current enrollments. Does not display conflicts for 2+ exams in one day for final exams.
Final Exam Assignments
Provides a list of courses and their exam time and location per Academic Unit or Course Subject. Courses will only appear under their administrative home.
Final Exam Needs Summary
Final Exam Needs Summary Report
Provides a list of submitted exam needs per academic unit or course subject.

